Molecular Simulation of Nanostructured Materials
Personnel: F.M. Capaldi, M. Hütter, A. Kalra, V.K. Kuppa, M.C.Boyce, D. M. Parks
Sponsorship: AFOSR DURINT, NSF CAEFF (sponsor contact information)
Introduction
 Nanostructured polymers, which display properties that vary with length scales comparable to molecular sizes, are increasingly important in the scientific and industrial world today. The study of these systems is effectively accomplished via molecular simulations that probe the behavior of polymers at the sub-micron/nanometer level. Such investigations are critical in enhancing our understanding of the influence of nanometer level structural variations on observed macroscopic properties. Semi-crystalline polymers and polymer nanocomposites are systems that exhibit intricate structure-property relationships, since they both include restricted polymer chains whose motion is hindered by nanoscale structural features. The macroscopically observed behavior of such materials is thus a consequence of the characteristic minute length scales of confinement.
1. SEMICRYSTALLINE POLYMERS
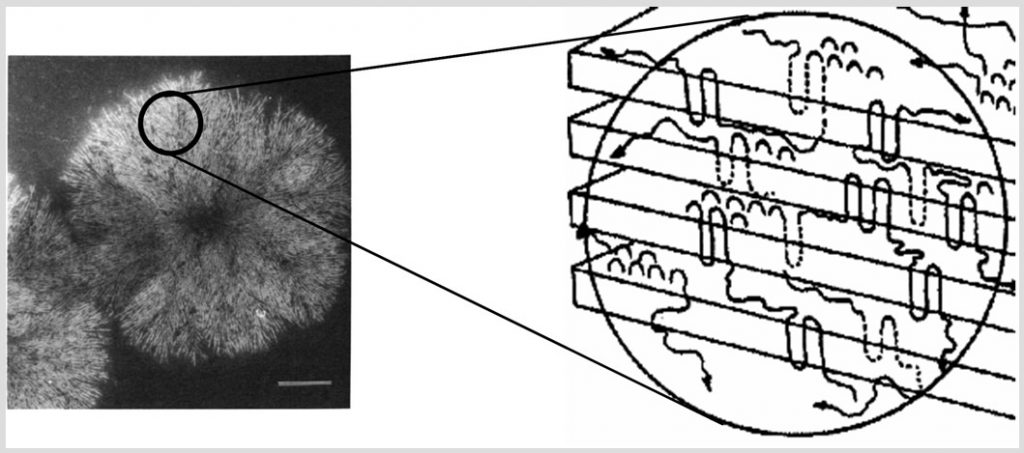
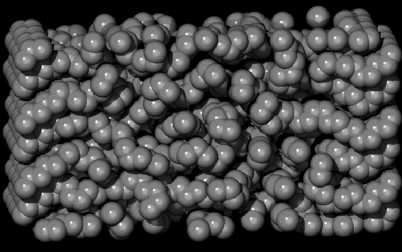
Crystallizable polymers are typically not fully crystalline in the solid state, even below the melting temperature, due to chain connectivity and frustration effects. Thus, typical “crystalline” polymers are comprised of interspersed regions of crystalline and amorphous material. The behavior of crystalline polymers is consequently determined by a mixture of characteristic properties resulting from purely crystalline and amorphous phases and the interplay between the two phases, separated by an interface (Figure 1). Since it is difficult to decouple experimentally the responses of the different phases due to their intricate morphological nature, we use molecular modeling of semicrystalline polymers to provide insight into the behavior of these materials.
1.1 Molecular Simulation of the intercrystalline region in Isotactic Polypropylene
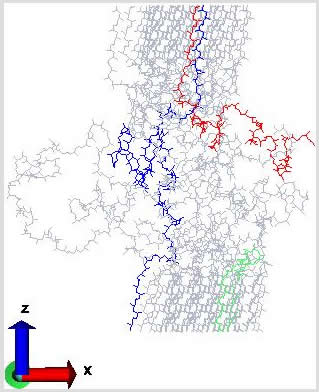
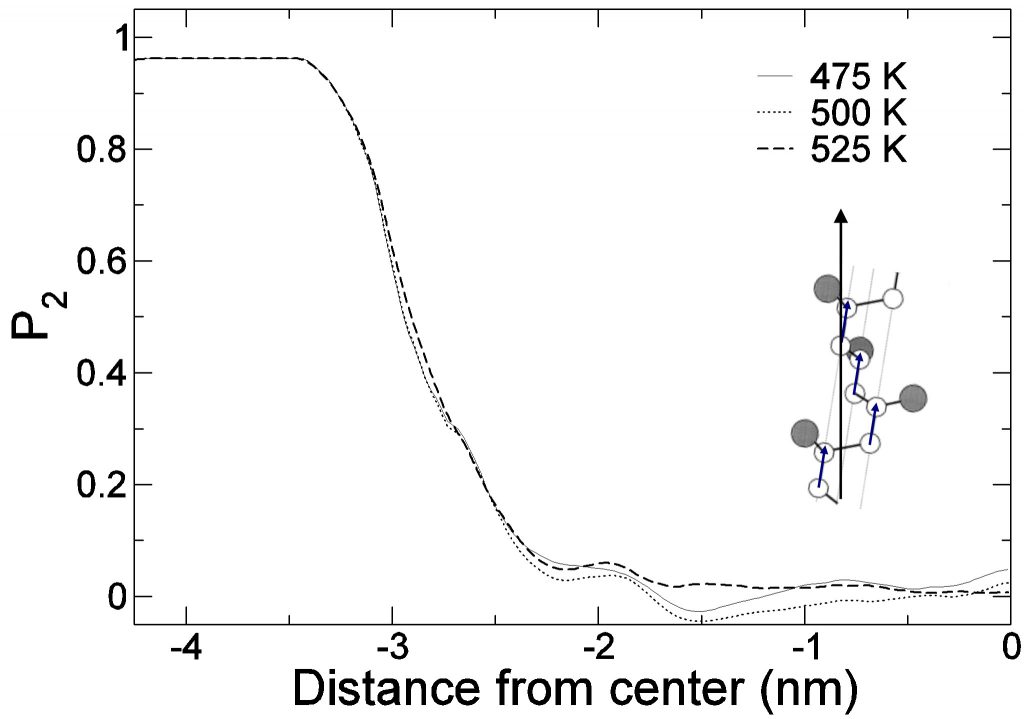
Monte Carlo (MC) computer simulations are used to probe the crystal-melt interlamellar phase in isotactic polypropylene. In conjunction with a united atom force-field model, the simulation setup mimics the typical crystal-constrained amorphous structure prevalent in semi-crystalline polymers. Replica exchange in energy space is employed in addition to local conformation and topology altering MC moves to speed up effective sampling of phase space and to elicit results for the thermomechanical properties of the interlamellar region. Simulations reveal the temperature dependence of structural features such as mass and energy density profiles as well as population distributions of tails, loops and bridges associated with the fold surface. In addition, we compare and contrast with results derived for a prototypical linear polymer like polyethylene in order to study the effect of architectural complexity on structure-property relationships in semi-crystalline polymers. Figure 1 shows a snapshot of the simulation cell corresponding to a {001} surface, with crystal lamellae sandwitching the amorphous region. In figure 2, we show the bond orientation profiles perpendicular to the crystal surface for isotactic polypropylene. The abscissa shows the distance from the center of the simulation box, and oridinate indicates average absolute orientation calculated over all bonds in a slice of width 0.035 nm.
1.2 Polyethylene and Freely Rotating Linear chains
Our group first reported Monte Carlo simulations of the interlamellar domain in 1998 [J. Chem.. Phys., 109, 6523 (1998)], using a united atom model similar to polyethylene. The lamellar fold surface is the most significant type of crystal-amorphous interface in polymers. Most recently, we have focused on the {201}-crystal surface in polyethylene, which is prominently observed in experiments and independently confirmed by us to represent a lowest energy state in freely rotating chain models [Macromolecules 33, 9136 (2000)], in the temperature range 380K to 450K.
The interface internal energy and the interface stresses are defined using the concept of the Gibbs dividing surface. We find that the internal energy of the interface is of the order 0.3-0.35 J/m2 [Polymer 47(2006), 5494]. The interface stresses are anisotropic for the {201}crystal surface, with values of approximately -0.27 J/m2 and -0.4 J/m2 for the xx- and yy-components, respectively. The anisotropy in the interface stresses originates from the 34deg. tilt angle at which the polymer chains exit the crystal. Furthermore, we note that the interface is under pressure, rather than tension, in accord with experiments, where lamellae having a higher surface to volume ratio exhibit a slight expansion of the crystal parameters. We also investigated the temperature dependent thermomechanical properties of the interlamellar phase in semicrystalline PE, using Monte Carlo molecular simulation [Macromolecules 39(2006), 439]
2. POLYMER NANOCOMPOSITES — HYBRID SYSTEMS
2.1 MD of Model Nanocomposites and PE/POSS
Polymer nanocomposites are a class of materials in which polymers are mixed with nanometer sized filler particles, including inorganic aluminosilicates and metal and inorganic oxides. Due to the fine scale of dispersion of the filler particles, as well as the large surface area of contact between the two phases, such polymeric nanocomposites (PNCs) display properties perceptibly different from both virgin polymers as well as conventional composites. We are currently engaged in performing molecular dynamics simulations to investigate the glass transition and the mechanical properties of ultra-thin model polymer films typically found in intercalated polymeric nanocomposites. Using the LJ-FENE bead spring model for oligomeric molecules confined between atomically defined FCC walls at various separations, we quantify the relaxation behavior of chains in such extreme confinements.
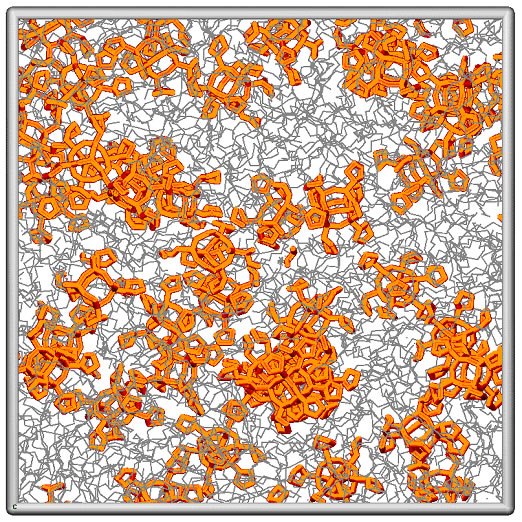
Composites of Cyclopentyl Polyhedral Oligomeric Silsesquioxane (CpPOSS) and polyethylene (PE) are particularly interesting because the length scale of the filler particle is on the order of the monomer size. POSS is a spherical inorganic silicon-oxygen framework with pendant organic groups that promote compatibility with the polymer matrix. We have used atomistic simulations to investigate the properties of POSS, polymer and the resulting interface between the organic matrix and inorganic filler. Simulations reveal that the presence of these nanoscopic filler particles (Figure 5), influences structural characteristics of the adjacent matrix material [Capaldi et al, Polymer, in press]. The alignment of polymer chains near the surface of the particle induces changes in their mobility. In particular, there seems to be additional mobility of the polymer along the surface of the filler with decreased mobility normal to the surface of the particle. Though the resulting interface is on the order of only a few angstroms thick, the interphase may occupy a large volume fraction of the matrix if the filler is well dispersed. This work clearly illustrates that unlike macroscopic composites, the third phase (the interphase) must be considered to determine the properties of this nanocomposite.
2.2 Calculation of Vibrational Spectra of Clay Platelets
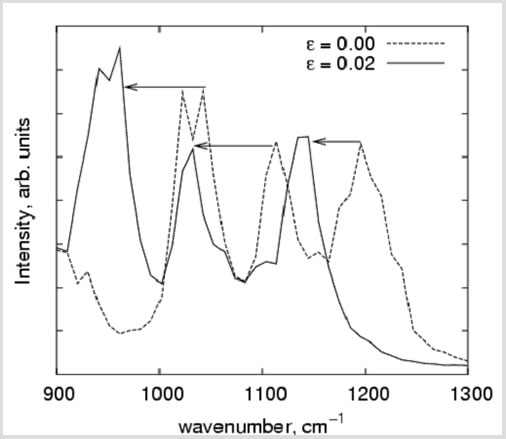
Polymers blended with sub-micron sized aluminosilicate clay platelets are among the most widely used class of nanocomposites, due to their enhanced mechanical and barrier properties. We have previously reported the use of molecular simulations to characterize the mechanical behavior of individual clay platelets, where traditional continuum concepts break down, [J. Phys. Chem. B, 108, 1428 (2004)] and have extended this work to model polymer-clay nanocomposite mechanics to study properties of clay and PNC systems [Polymer, 45, 487 (2004)]. To understand the molecular details of load transfer from the polymer matrix to the clay particles, we used molecular simulations to determine the vibrational density of states of clay and to calculate spectral shifts with applied strain on the filler (“microstrain”) for significant peaks in the clay spectra (Figure 6). Our results can then be used to rationalize the results reported by continuum level composite modeling (with relates macrostrain to microstrrain) and experimental NMR studies (which relate macrostrain to spectral shifts). By relating spectral shifts to microstrain, we provide the missing link between these two sets of studies, thereby obtaining an internally consistent and complete analysis of a PNC in deformation.